SOLUTION
Vulnerability Management - Integration with Leading Scanners
Customers will receive a holistic, meaningful single-pane-of-glass overview of their entire environment, with less manual effort.
Main Benefits
Enhance overall security posture with minimal manual effort.
Simplified Vulnerability Management

Allgress integrates vulnerability data with other risk sources into one console, providing actionable workflows from scan results.
Enhanced Risk Visibility and Prioritization
Allgress integrates vulnerability, penetration, and other security data into business-ready formats with projected risks.
Comprehensive Risk Analysis
This capability enables organizations to identify and address all types of risks, including vulnerabilities, with a holistic, single-pane-of-glass overview.

Streamlined Integration with Leading Scanners
Effortlessly integrate with top industry vulnerability scanners like Qualys and Nessus, leveraging existing vulnerability data to eliminate duplication and enhance efficiency in vulnerability management processes.
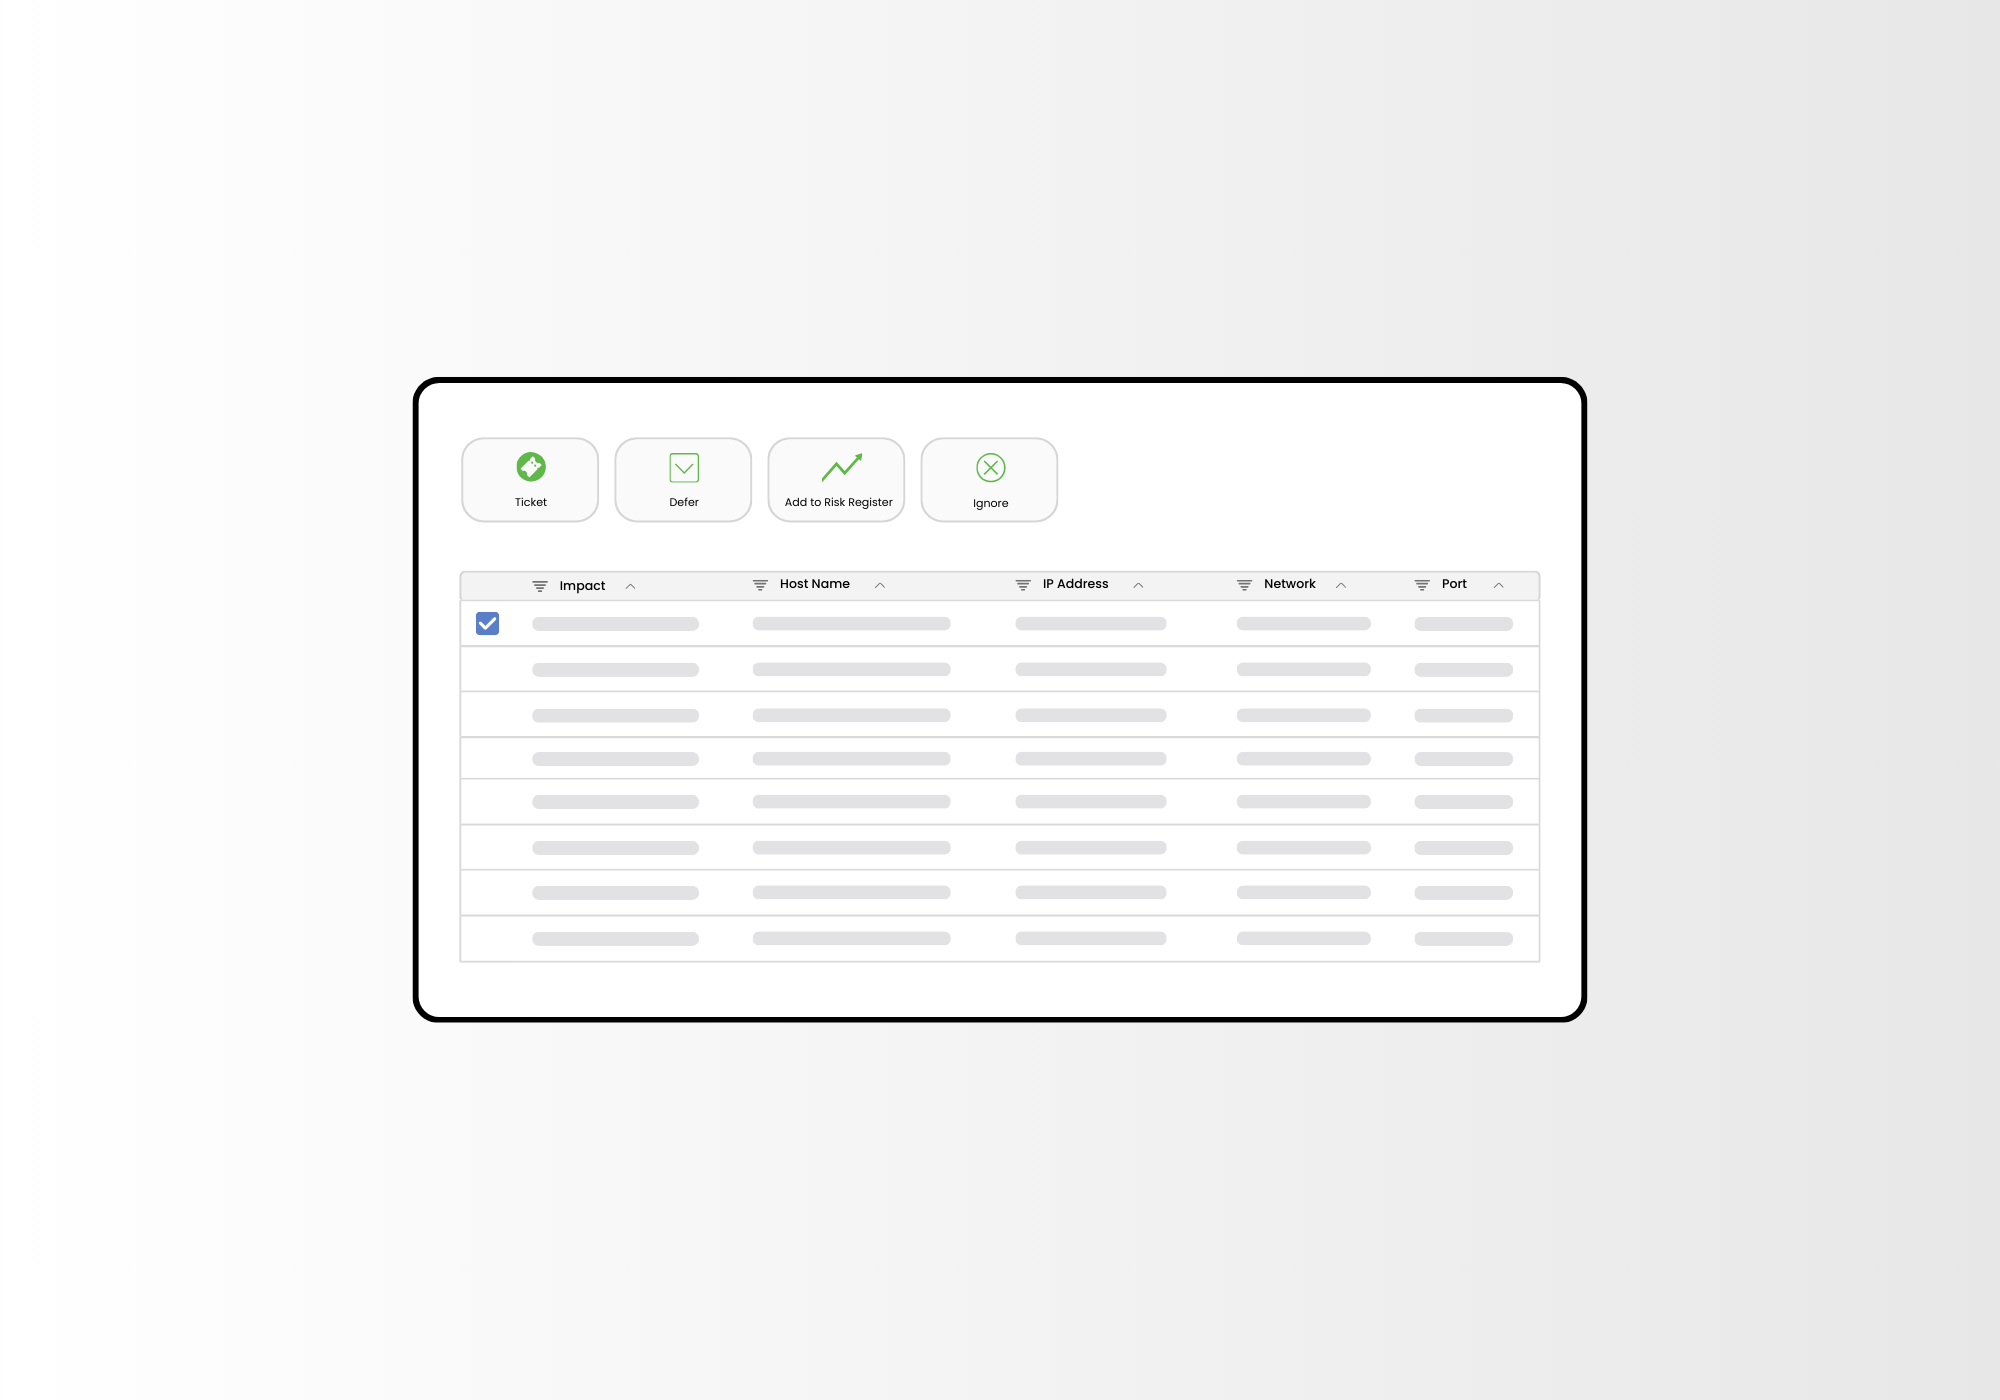
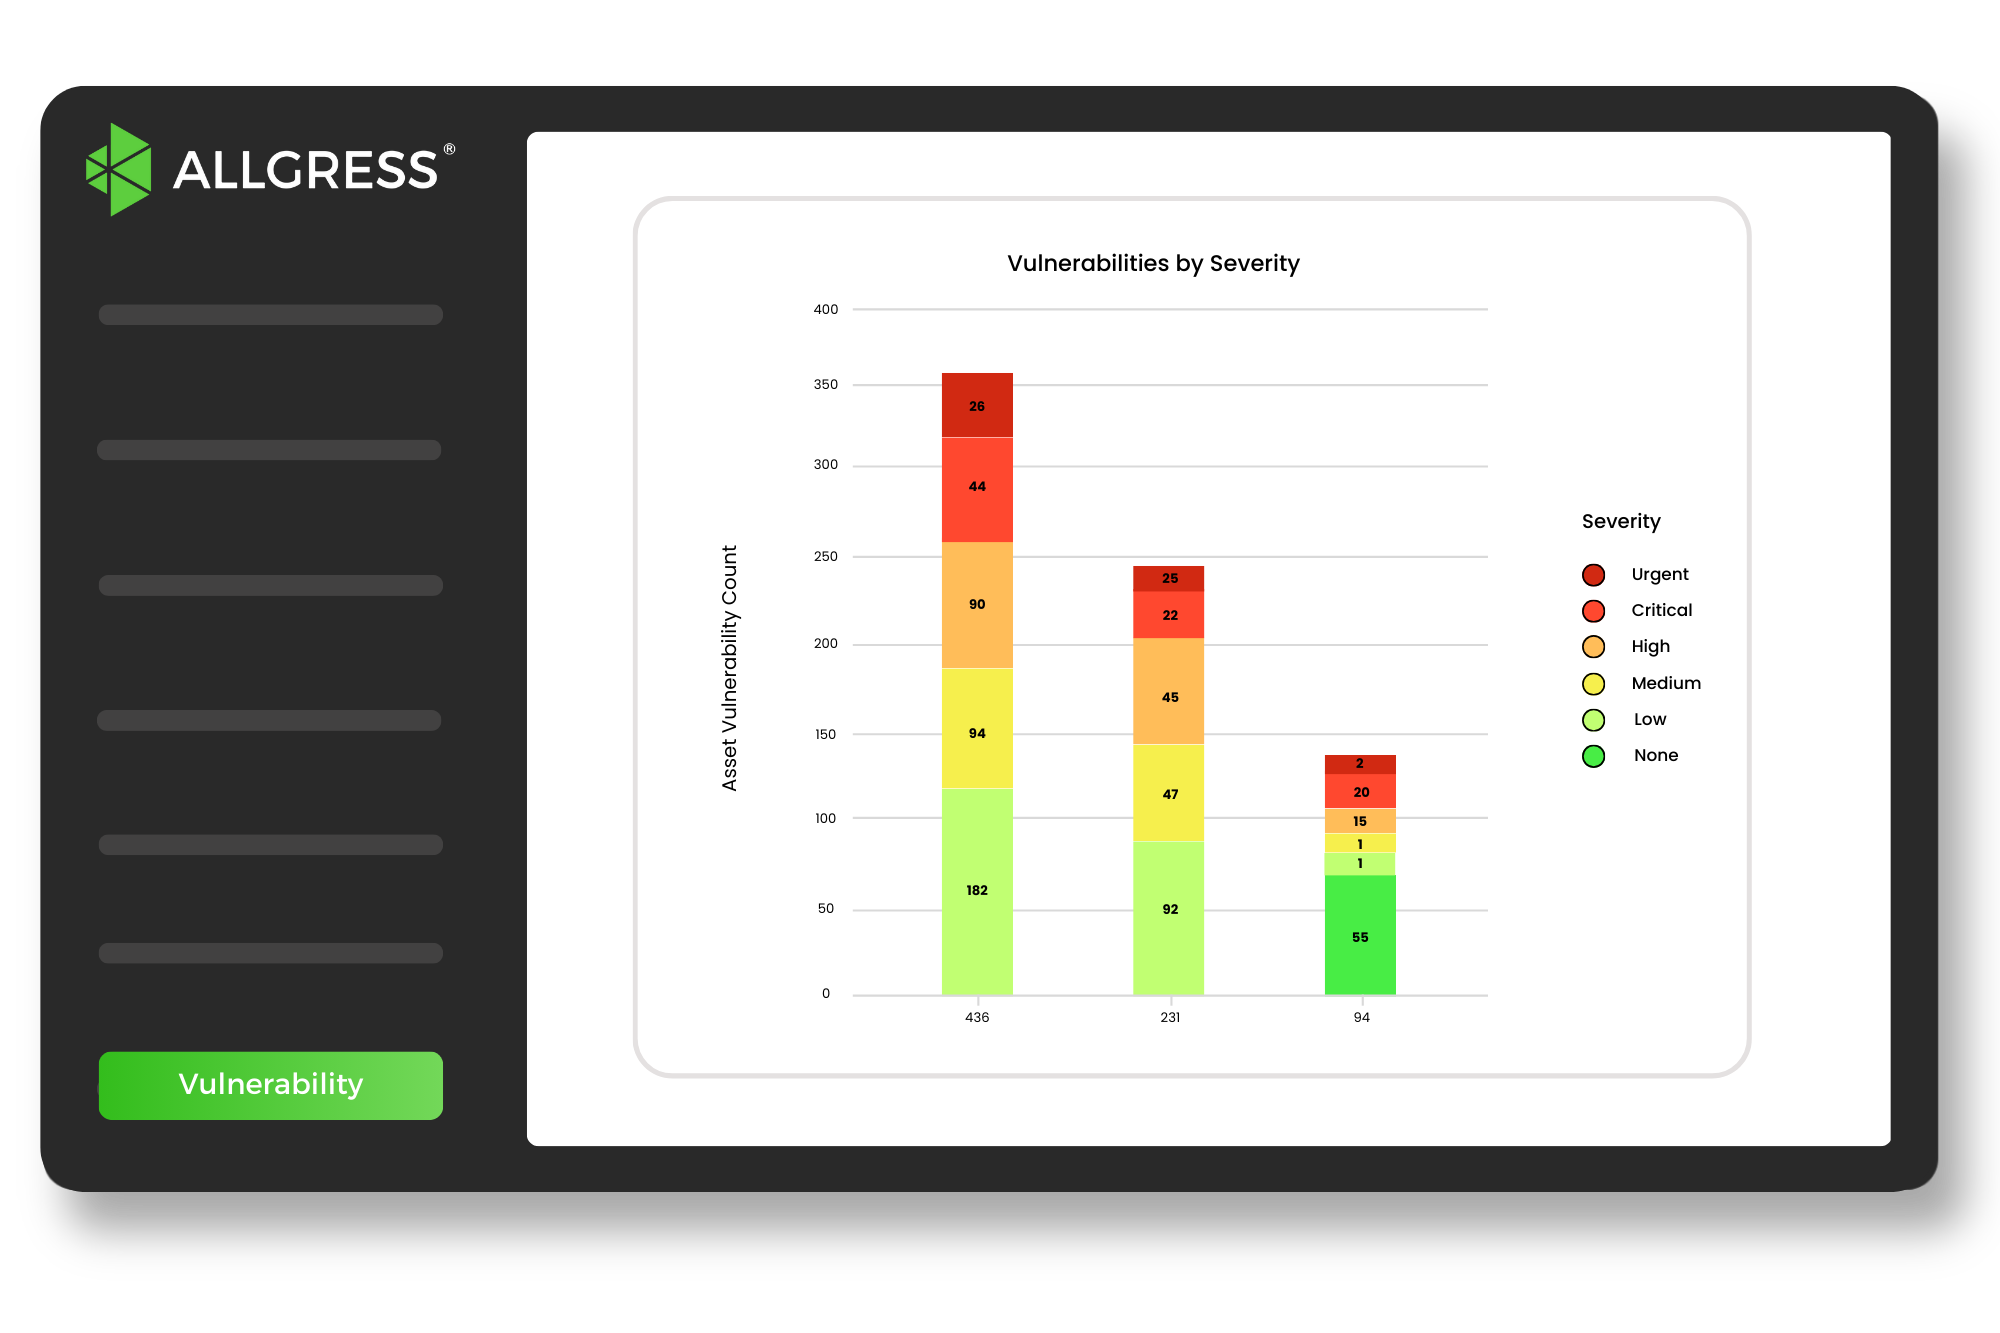
Actionable and Prioritized Results
Transform raw vulnerability scanning data into prioritized and actionable results, improving efficiency through data consolidation and automated workflows.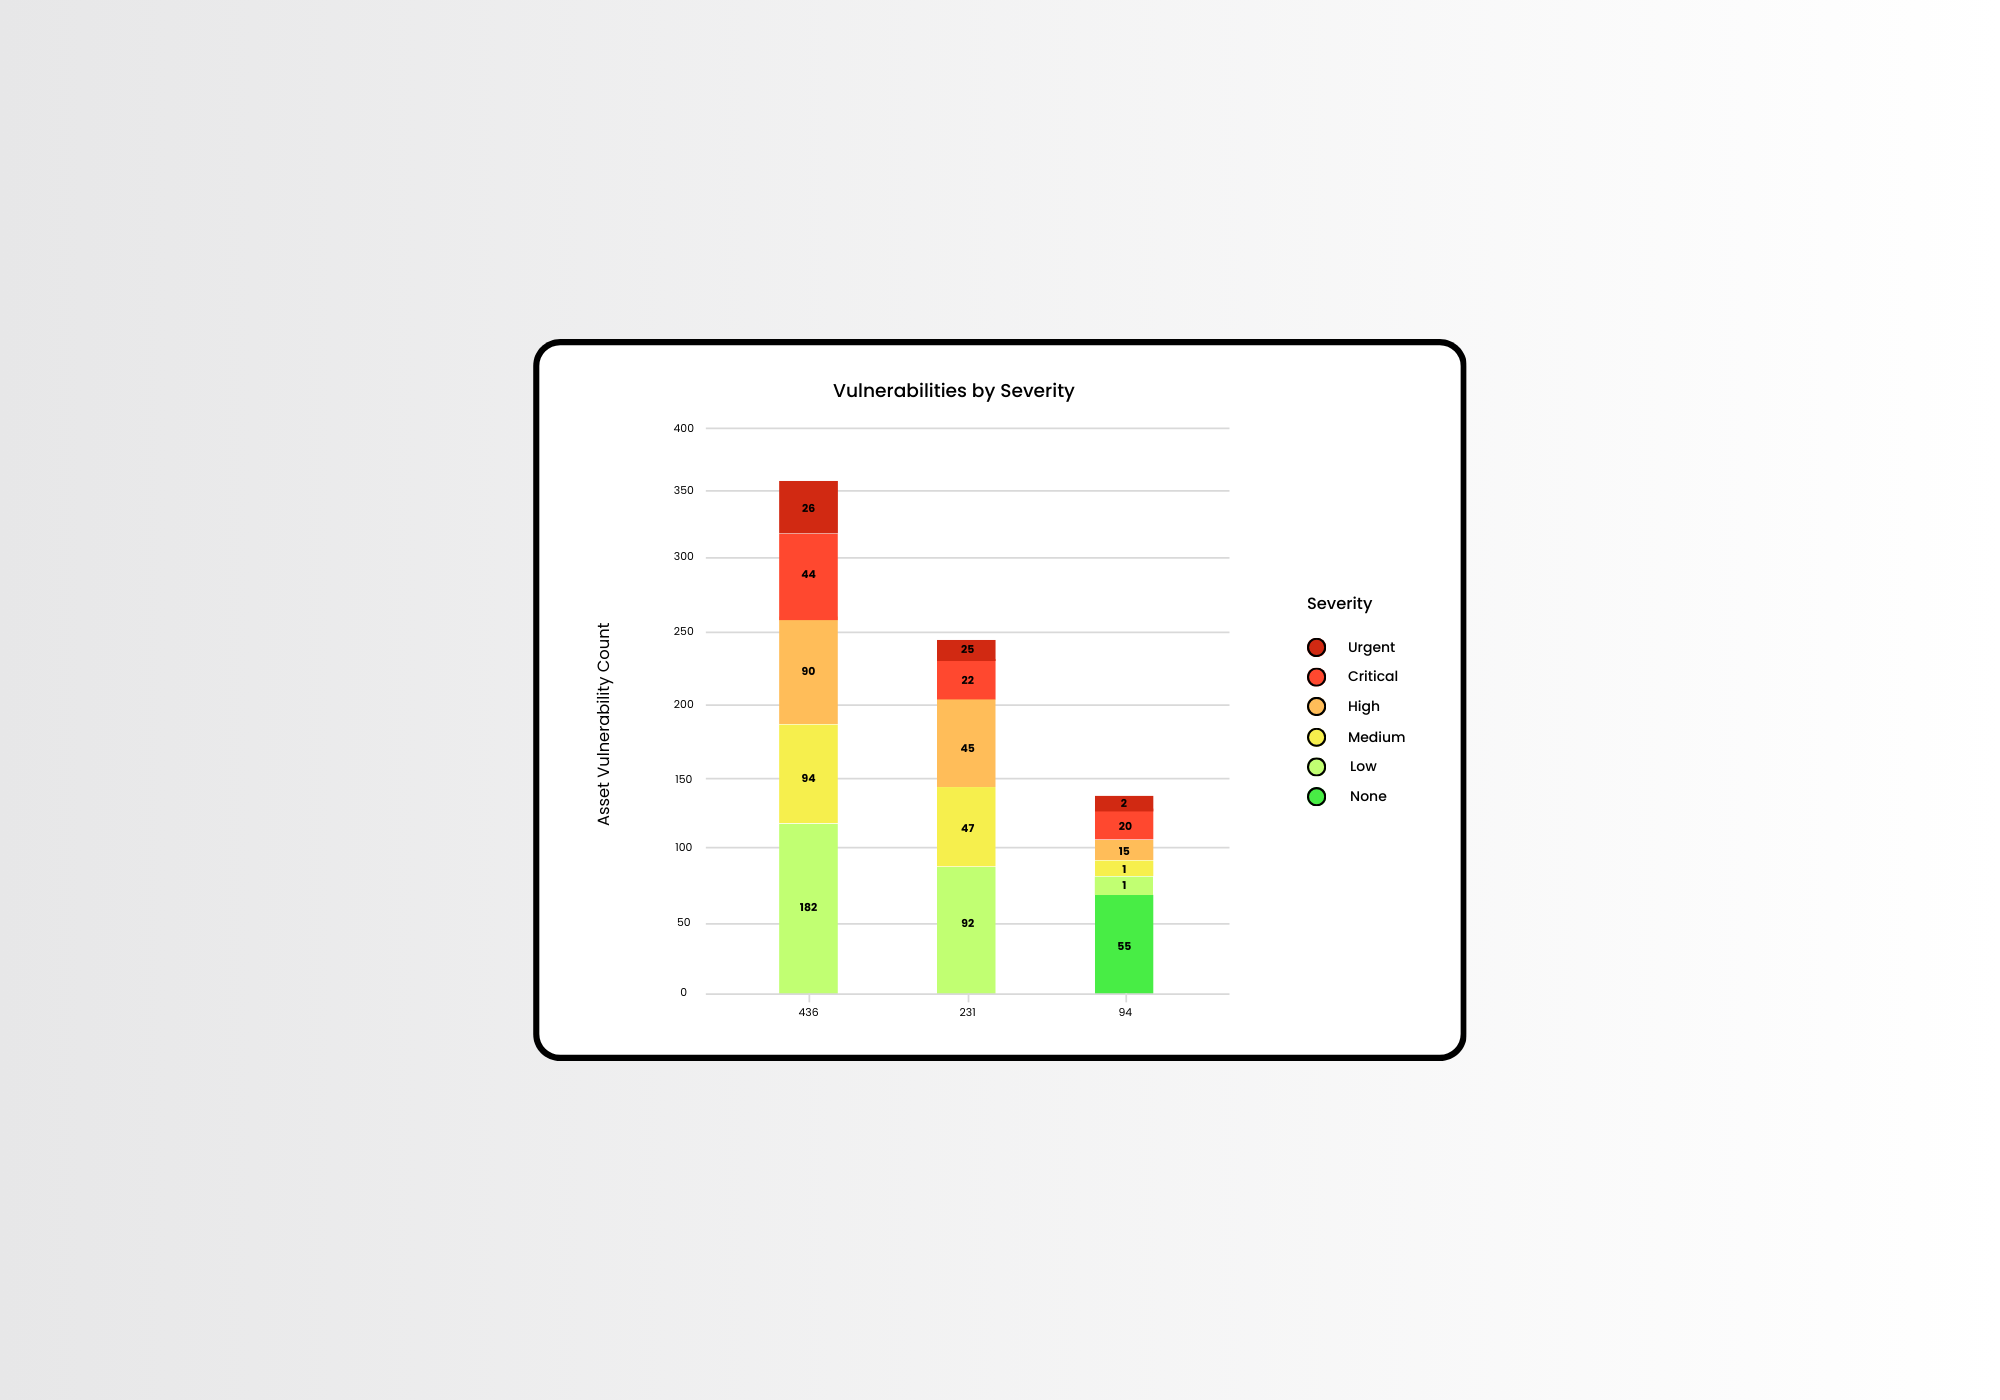
Risk Prioritization and Reporting
Prioritize vulnerabilities based on business impact, linking them directly to risks in the Allgress Risk Register for informed decision-making. Offer comprehensive insights beyond point-in-time views, including trending data and real-time reports to facilitate proactive risk mitigation strategies.Explore Allgress Products